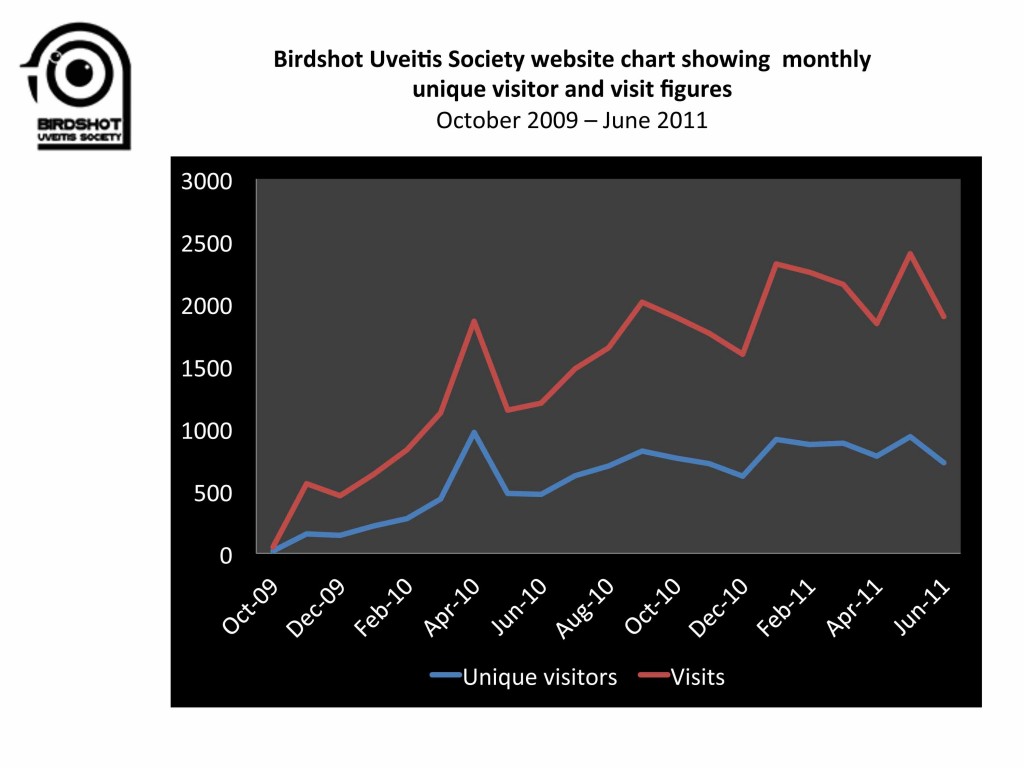
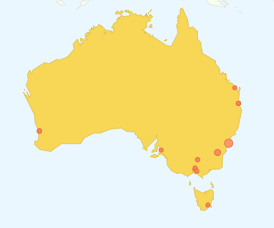
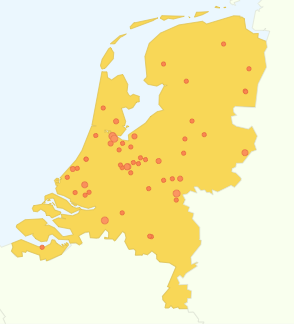
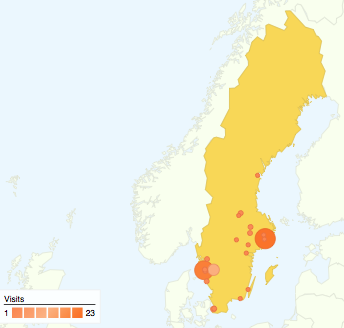
 Using Google Analytics we took a look at the monthly figures showing the number of unique visitors (i.e. the people who log on who have never logged on before), how many visits, the average length of visit and from what countries.
The map to the left shows all the places in the UK where people have visited from October 2009 (when we launched the website) until now (end of June 2011). On average we are now getting 700 visits a month from the UK. Since October 2009 there have been 11,996 visits from here.
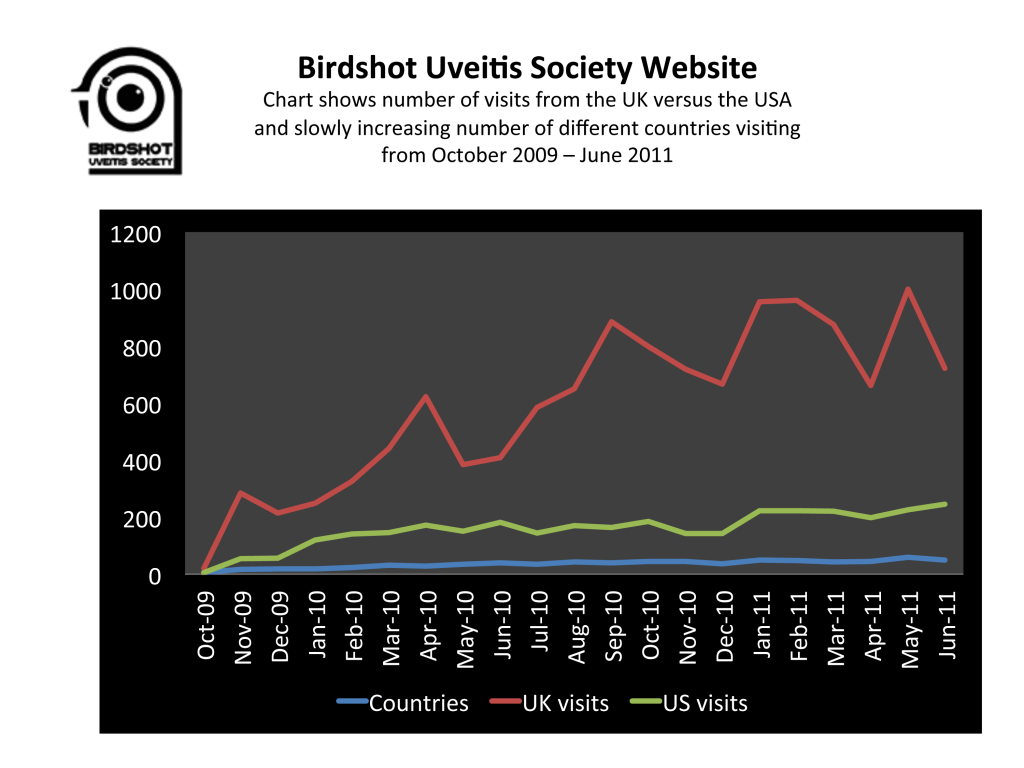
Below are a couple of charts that show how the traffic has increased over the period the website has been published. The number of countries now visiting the site is over 50. Our main traffic comes from the UK, with the USA coming in second. We have also analysed the other countries from which we receive visits – it is no surprise that we tend to have the highest number of visits from those countries where there is a large european or caucasian population as the HLA A29 antigen tends to predominate in this population. All in all, we feel that the number of visits we get, combined with our growing membership base, and the number of requests we get for information shows that BUS is performing a really useful function.
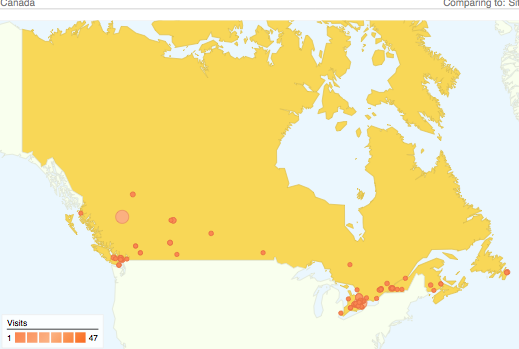
We thought it might be interesting to show some of the other countries where people visit the BUS website (see below). During this period, there have been 3,048 visits from the USA and 373 visits from Canada. There are also maps and figures for France, Germany, India, Australia, Belgium and Netherlands.
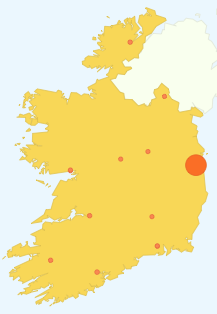
In Ireland the number of visits since the site was established is 111.
United States of America 3,193 visits since October 2009
In Canada 399 visits
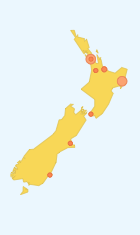
In New Zealand there have been 89 Visits
In Austalia 166 visits
In France there have been 190 visits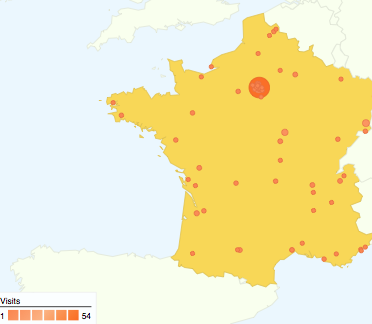 .
.
In Belgium there have been 126 visits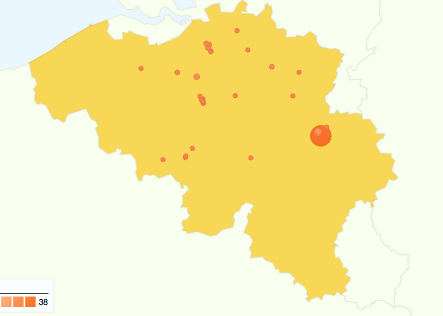
In Sweden 88 Visits.
